Happy New Year everyone!
I hope the holiday season was full of beer, wine, grub and every other kind of delightful merriment imaginable. The bear is back and absolutely raring to go! So, in an attempt to be a little more diligent and focused, I’ll crack on with the list of goodies I wanted to cover; starting with a small post on F# charting capabilities.
If you read my previous posts on Future Decoded 2015 and F# you’ll know that I’ve built up a little bit of a soft spot for F# (again, just to reiterate, the Don Syme Future Decoded F# Breakout Session was excellent and is a must watch). To continue on my journey a little bit I wanted to move beyond syntax, basic data aggregation/manipulation and type providers to touch on data presentation; namely the F# charting assemblies specifically.
Here’s a quick guide on how to get started in Visual Studio:
Project Setup
To get started from Visual Studio you have a couple of choices; you can create a full blown F# Library Project (for a more in depth/permanent piece of code) or, within Visual Studio 2015 at least, you can simply create an F# script to be run in F# Interactive without the overhead of a Project. As I’ll be bringing the F# Charting Library into scope, using NuGet, a project makes more sense in this instance, but here are the steps on both should you feel nosey:
Create an F# Script
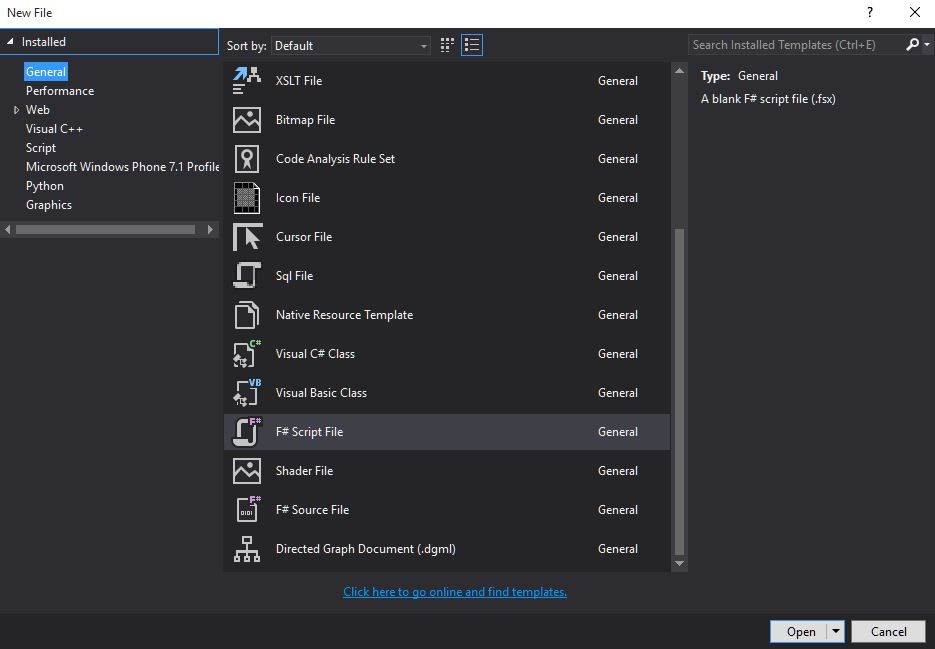
Go to the File > New menu within Visual Studio 2015 and select the File option (without a Solution or Project currently open). You can then simply select the F# Script File option to get rocking and rolling:
Create an F# Project
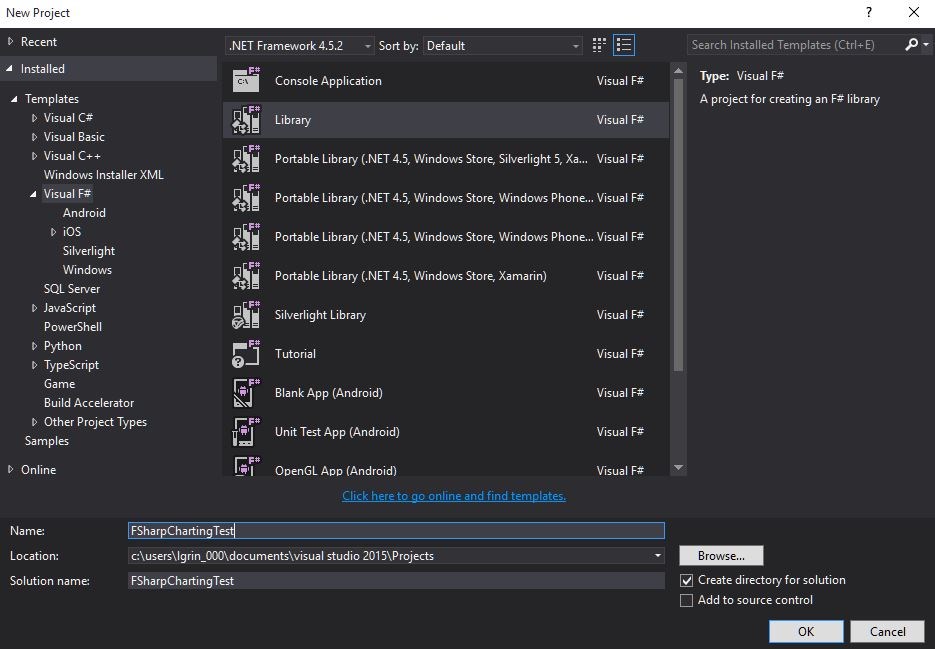
As per any other project you can simply navigate to File > New > Project and select the Visual F# templates. You’ve got options for creating Console Applications, Portable Libraries, Unit Test Applications, etc. From what I’ve seen, the Tutorial project is actually well worth a look, this can be used in conjunction with the tryfsharp website to grease the wheels if needed! For this project, the normal F# Class Library will suffice:
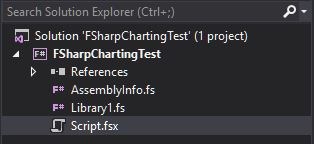
Once your project is created you can access and begin scripting using the .fsx file included in the project; no sweat so far!
As an aside, the F# Interactive window (where output is logged for an F# script file) can be accessed from the View > Other Windows > F# Interactive (Ctrl + Alt + F) option.
For those who want to hoover up more background knowledge, further information surrounding writing F# within Visual Studio can be found here:
Using Visual Studio to Write F# Programs
F# Charting Assemblies
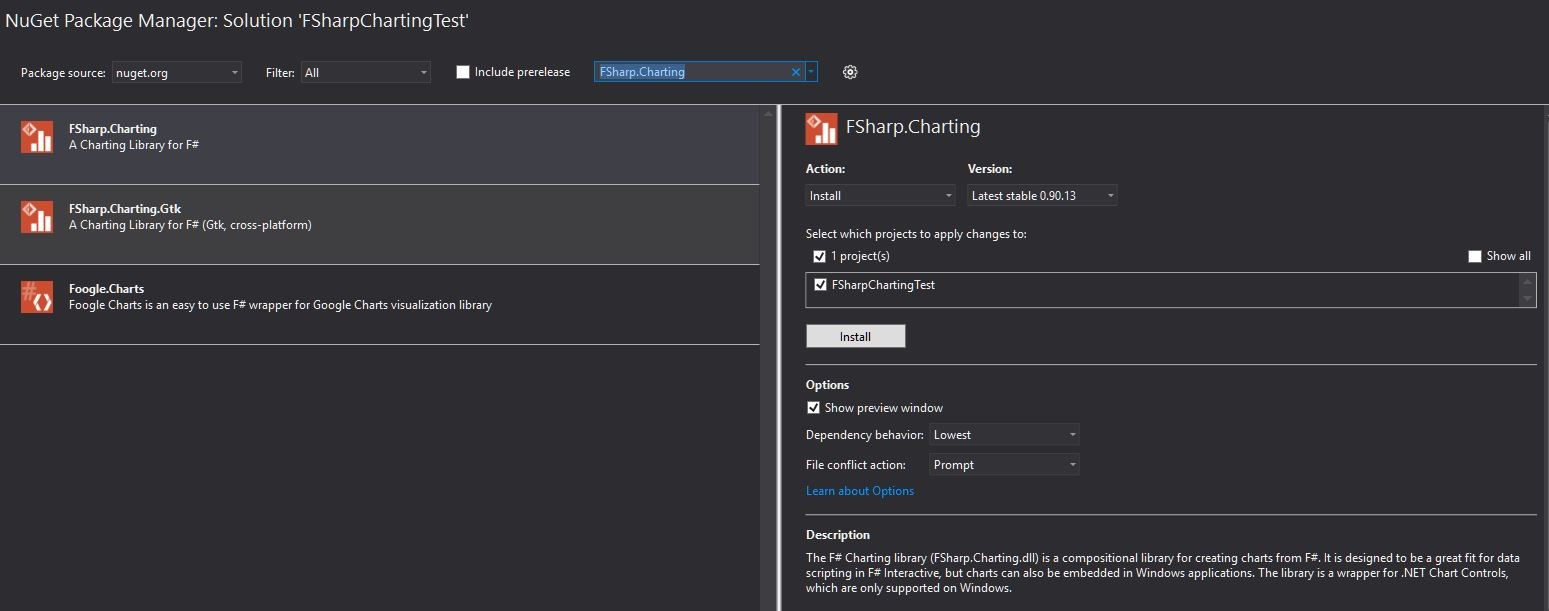
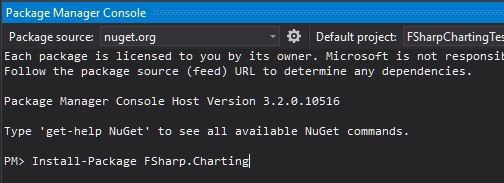
We next have to ‘NuGet it up’ and bring some extra resources into scope. This can be done using the Tools > NuGet Package Manager > Manage NuGet Packages for Solution option and then searching for FSharp.Charting, followed by clicking install (see image below), or more simply via the Package Manager Console found under Tools > NuGet Package Manager > Package Manager Console and use the command ‘Install-Package FSharp.Charting’:
Further gubbins on how to install the FSharp Charting Library on other environments (and a link to the NuGet package we’ve utilised here for reference) can be found here:
F# Charting: Library for Data Visualisation
F# Charting (NuGet)
Once you’ve installed the package using either method we’re nearly ready to get charting.
At this point, to run the examples coming up, you’ll also need to:
- Install the FSharp.Data NuGet package (using exactly the same process as detailed above). Command: ‘Install-Package FSharp.Data’.
- Install the FSharp.Data.TypeProviders package (again, using the same process detailed above). Command: ‘Install-Package FSharp.Data.TypeProviders’.
- Reference System.Drawing within your F# Project (using References > Right Click > Add Reference > Assemblies > Framework).
More information here:
FSharp.Data NuGet Package
FSharp.Data.TypeProviders NuGet Package
We’re fully set and ready to go, so on to the charting!
Line Chart
The plan here is to briefly demonstrate each type of chart in action. This first example will be a basic evolutionary piece showing an expansion from a bare bones chart into a more full example utilising some more complex constructor options and styling tweaks (nothing too meaty however!).
Within your .fsx script file you’ll need to begin with the following (highlight the lines and use Alt + Enter to run the code within F# Interactive. If you’re using ReSharper be aware that this keyboard shortcut may be mapped, so you might have to do some jigging!):
//Give F# Interactive awareness of the packages folder (it will allow easier loading/references of resources below)
#I "..\packages"

//Read, compile and run the FSharpt.Charting.fsx file (to access the functionality of FSharp.Charting.dll)
#load "FSharp.Charting.0.90.13\FSharp.Charting.fsx"

//Read in the FSharp.Data and FSharp.Data.TypeProviders assemblies (so we can make use of the HtmlProvider)
#r @"FSharp.Data.2.2.5\lib\net40\FSharp.Data.dll"
#r @"FSharp.Data.TypeProviders.0.0.1\lib\net40\FSharp.Data.TypeProviders.dll"

//Access namespaces as required by the examples. System for the 'Random' type and use of String.Format, FSharp.Data for the HtmlProvider, FSharp.Charting for what is says on the tin
//and System.Drawing for chart styling elements
open System
open FSharp.Data
open FSharp.Charting
open System.Drawing

//Write code to utilise FSharp.Charting
//...
You will see dialogs matching the following thrown during this process, you’ll need to select ‘Enable’:

Now, some of these reference assemblies and opened namespaces are required for later examples; we’re just getting F# Interactive primed and ready so we don’t have to do any further work down the road. Here’s a quick rundown on the directives being used here:
- #I: Specifies a search (hint) path so that F# Interactive can intelligently search for resources you reference.
- #load: Reads, compiles and runs the specified resource.
- #r: References an assembly directly.
- open: Imports an assembly (like a C# ‘using’) ready for use in F# code.
In short, we add a search path using #I so F# Interactive can more easily find resources (in our packages directory) without the need to provide a full, absolute path. The #load directive reads, compiles and runs the FSharp.Charting.fsx file, which neatly references the FSharp.Charting assembly as well as the supporting System.Windows.Forms.DataVisualization assembly. A hop, skip and jump later, we can then reference assemblies (added by NuGet) in the packages directory in a more simple manner using #r (you could just as easily references dlls from the bin folder, I need to do some further reading on this to get a feeling for best practice). Lastly, open (begin ‘using’) namespaces linked to these resources as required, boom!
Here’s a wonderful little list detailing the ins and outs of fsi.exe for those who want to delve further.
What can we do with all of this magic…make a chart of course; starting with charting 101, the line chart (run this in F# Interactive as before by highlighting the code and using Alt + Enter):
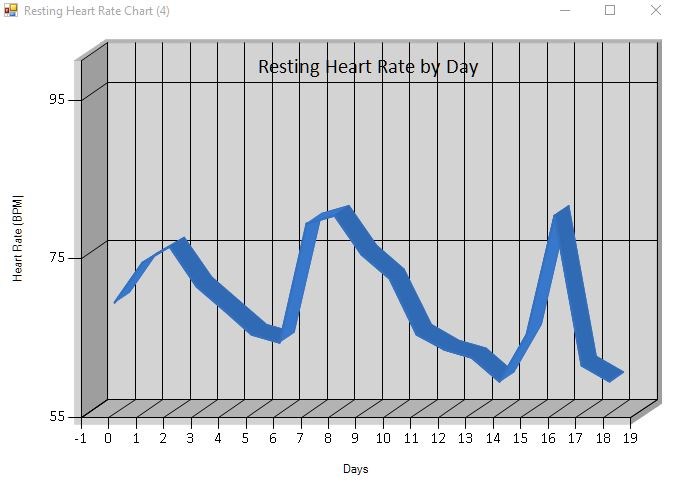
//Define an array of resting heart rate values
let restingHeartRateValues = [69; 74; 76; 71; 68; 65; 64; 79; 80; 75; 72; 65; 63; 62; 59; 65; 80; 61; 59]

//Produce a line chart to visualise this data
Chart.Line(restingHeartRateValues)
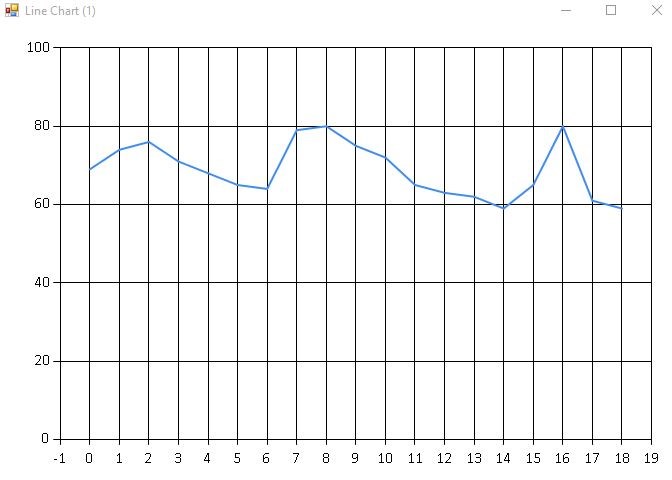
That’s it, first chart down! The resting heart rate values array (I’m still getting used to semi-colon separated values!) is used as the ‘data’ input for a call to Chart.Line. The next few code snippets illustrate some alternative syntax for this operation. You can use the ‘|>’ syntax if you just wish to produce a chart with no bells and whistles. For extra levels of shininess (i.e. styling the chart) you can add additional method calls as required. Let’s go through some examples:
//Inline the array directly into the call to Chart.Line
Chart.Line([69; 74; 76; 71; 68; 65; 64; 79; 80; 75; 72; 65; 63; 62; 59; 65; 80; 61; 59])

//Or, alternatively, calling the basic Chart.Line constructor using |> syntax
[69; 74; 76; 71; 68; 65; 64; 79; 80; 75; 72; 65; 63; 62; 59; 65; 80; 61; 59]
|> Chart.Line
//Define an array of resting heart rate values
let restingHeartRateValues = [69; 74; 76; 71; 68; 65; 64; 79; 80; 75; 72; 65; 63; 62; 59; 65; 80; 61; 59]

//Produce a line chart to visualise this data (with a Name, Title and labels for the X and Y axis)
Chart.Line(restingHeartRateValues, Name = "Resting Heart Rate Chart", Title = "Resting Heart Rate by Day", XTitle = "Days", YTitle = "Heart Rate (BPM)")
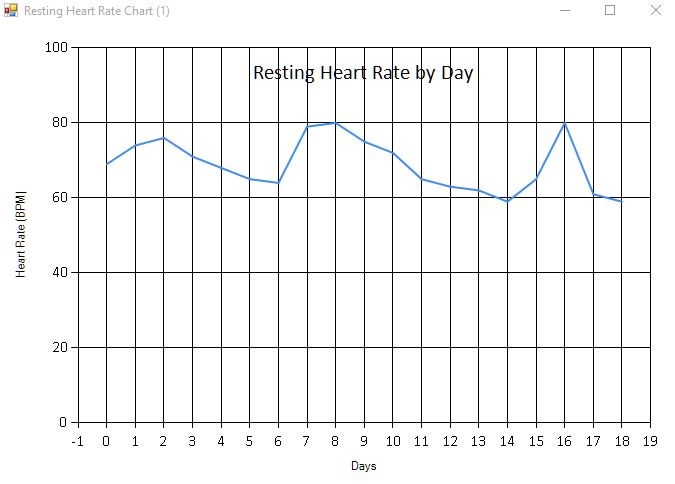
Here, we called some additional constructor arguments of Chart.Line (by name) to name the chart (this appears in the chart window header), give the chart a title (which appears within the chart window, normally overlaying the chart), in addition to naming the chart axis labels.
//Define an array of resting heart rate values
let restingHeartRateValues = [69; 74; 76; 71; 68; 65; 64; 79; 80; 75; 72; 65; 63; 62; 59; 65; 80; 61; 59]

//Produce a line chart to visualise this data (with a Name, Title and labels for the X and Y axis)
Chart.Line(restingHeartRateValues, Name = "Resting Heart Rate Chart", Title = "Resting Heart Rate by Day", XTitle = "Days", YTitle = "Heart Rate (BPM)"
).WithYAxis(Min=55.0) //X Axis starts at 55
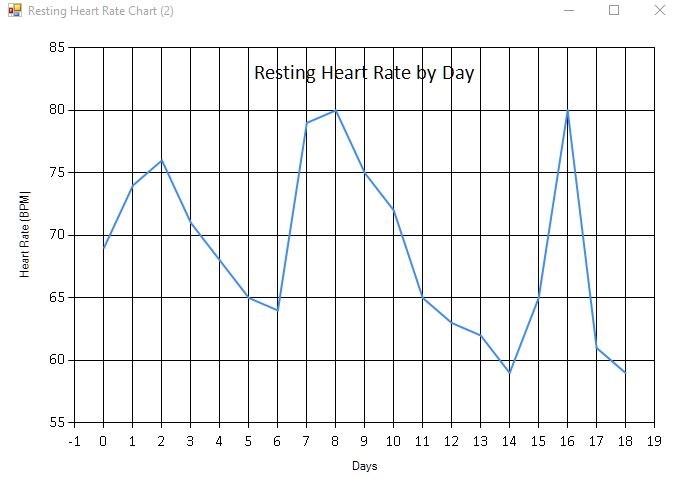
A slight extension to the above example, you can perform fine-tuning of each axis (you can control the label this way also) by calling WithYAxis or WithXAxis. In this case, I’m specifying a minimum value for the given axis to control how the chart is presented, all very fine and dandy. On to the next example we go.
//Define an array of resting heart rate values
let restingHeartRateValues = [69; 74; 76; 71; 68; 65; 64; 79; 80; 75; 72; 65; 63; 62; 59; 65; 80; 61; 59]

//Produce a line chart to visualise this data (with a Name, Title and labels for the X and Y axis)
Chart.Line(restingHeartRateValues, Name = "Resting Heart Rate Chart", Title = "Resting Heart Rate by Day", XTitle = "Days", YTitle = "Heart Rate (BPM)"
).WithYAxis(Min=55.0).With3D() //X Axis starts at 55 and with 3D (no extra 3D parameters specified, just as is)
In this final snippet I’ve added a call to With3D, because I couldn’t resist seeing what the chart looked like (what a sucker)!
Column Chart
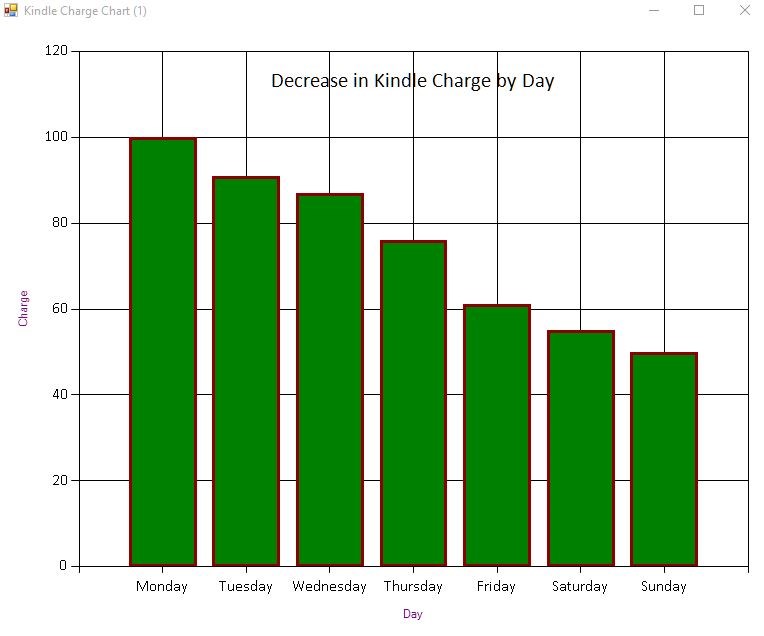
Following up, a couple of iterations of a column chart can be found below (using a string * int list representing Kindle Charge data). This illustrates how to further style the X and Y axis definitions, as well as apply some styling to the chart in general.
//Produce some test data (representing a drop in Kindle charge by day)
let kindleChargeData = [
    "Monday", 100;
    "Tuesday", 91;
    "Wednesday", 87;
    "Thursday", 76;
    "Friday", 61;
    "Saturday", 55;
    "Sunday", 50;
]

//Produce a column chart (with some basic styling for the chart; covering colours and borders, etc.)
Chart.Column(kindleChargeData, Color=Color.Green, Name = "Kindle Charge Chart", Title = "Decrease in Kindle Charge by Day"
).WithXAxis(Title = "Day", TitleColor = Color.Purple
).WithYAxis(Title = "Charge", TitleColor = Color.Purple
).WithStyling(BorderColor = Color.DarkRed, BorderWidth = 3)
Same again, except for in 3D (with a limit of 100 ‘units’ placed on then Y axis):
//Produce some test data (representing a drop in Kindle charge by day)
let kindleChargeData = [
    "Monday", 100;
    "Tuesday", 91;
    "Wednesday", 87;
    "Thursday", 76;
    "Friday", 61;
    "Saturday", 55;
    "Sunday", 50;
]

//Produce a column chart (with some basic styling for the chart; covering colours and borders, etc.)
Chart.Column(kindleChargeData, Color=Color.Green, Name = "Kindle Charge Chart", Title = "Decrease in Kindle Charge by Day"
).WithXAxis(Title = "Day", TitleColor = Color.Purple
).WithYAxis(Title = "Charge", TitleColor = Color.Purple, Max = 100.00           //Apply a max here to prevent the chart from going beyond 100 on the Y axis
).WithStyling(BorderColor = Color.DarkRed, BorderWidth = 3
).With3D()                                                                      //Because I can't resist!!!

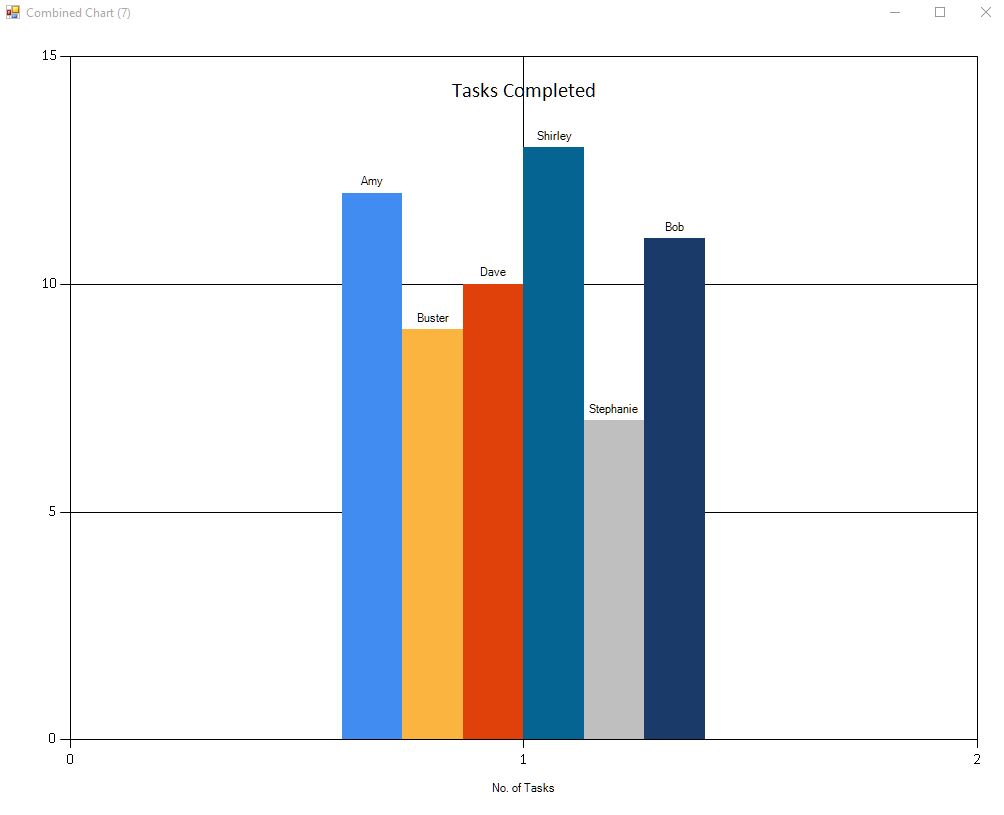
Just as a brief illustration, it is possible to combine individual charts into a unified entity using Chart.Combine as follows:
//A brief Chart.Combine example
Chart.Combine(
    [
        Chart.Column([ 12 ], Labels = ["Amy"])
        Chart.Column([ 9 ], Labels = ["Buster"])
        Chart.Column([ 10 ], Labels = ["Dave"])
        Chart.Column([ 13 ], Labels = ["Shirley"])
        Chart.Column([ 7 ], Labels = ["Stephanie"])
        Chart.Column([ 11 ], Labels = ["Bob"])
    ]
    ).WithTitle(Text = "Tasks Completed"
    ).WithXAxis(Title = "No. of Tasks"
    ).WithYAxis(Max = 15.00)
Bar Chart
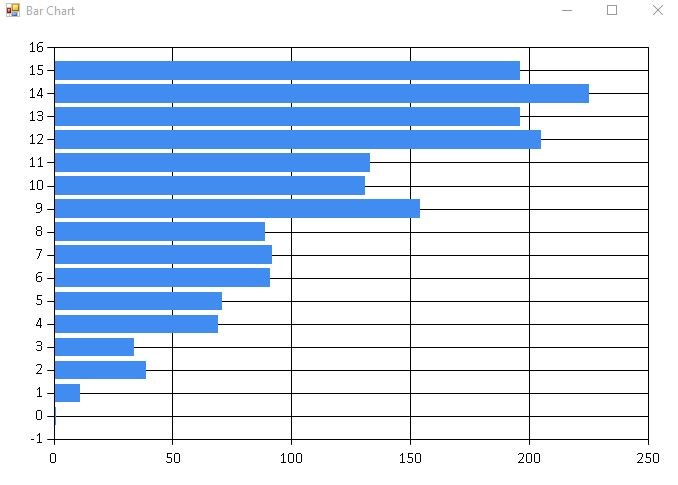
In this example we introduce the use of System.Random to produce a bar chart. After creating and binding ‘randomValue’ we utilise this in the construction of a for loop (which creates an integer list based on a number multiplied by a random number between a minimum and maximum limit). Drawing from previous learning, I’ve then mapped each value in this first list to an additional function (using List.map) to add another random value on to each initial integer. Lastly, we call Chart.Bar (the most basic form of the constructor) with the resultant data. Comments are inline to hopefully clarify how the code is working:
//Bind a new variable to use in RNG
let randomValue = new Random()

//Using alternative syntax this time as we are not calling a more complex Chart.Bar constructor (for styling purposes, etc.). Do some RNG and produce a bar chart
[ for i in 0..15 -> i * randomValue.Next(10, 20) ]      //For zero to fifteen, times i by a random value (between the minimum and maximum specified)
|> List.map(fun i -> i + randomValue.Next(1, 2))        //Map the result list to another function that adds another random value (between the minimum/maximum specified) to each initial value
|> Chart.Bar                                            //Produce the chart
Pie Chart
Moving on, we have a slightly more in depth example here using the HtmlProvider to scrape data off of a couple of Wiki pages for use in pie charts. The first example illustrates the breakdown of house types within Leigh in Surrey (I’ve never been but I’m sure it’s lovely. Leigh, here is your moment in the limelight!):
//Get a type denoting our pages structure (so we can strongly type against it), then retrieve live data by calling .Load
type WikiSurreyLeighStructure = HtmlProvider<"data_structure.html">
let liveDataTable = WikiSurreyLeighStructure.Load("https://en.wikipedia.org/wiki/Leigh,_Surrey").Tables.``Demography and housing 2``

//Prepare data scraped from the web page (details on the housing types in Leigh, Surrey)
let propertyTypeData = [
    String.Format("Detached ({0})", liveDataTable.Rows.[0].Detached), liveDataTable.Rows.[0].Detached
    String.Format("Semi-Detached ({0})", liveDataTable.Rows.[0].``Semi-detached``) , liveDataTable.Rows.[0].``Semi-detached``
    String.Format("Terraced ({0})", liveDataTable.Rows.[0].Terraced), liveDataTable.Rows.[0].Terraced
    String.Format("Apartments ({0})", liveDataTable.Rows.[0].``Flats and apartments``), liveDataTable.Rows.[0].``Flats and apartments`` ]

//Display this data in a styled Pie Chart
Chart.Pie(propertyTypeData
).WithTitle(Text = "Property Types in Leigh (Surrey)", FontSize = 26.00, FontStyle = FontStyle.Bold
).WithStyling(BorderColor = Color.BlueViolet, BorderWidth = 2
).With3D()

I’ve added the data_structure html document into the root of my project to provide F# with an understanding of the structure of the HTML page I want to interrogate (i.e. provide an entity which I can strongly type against). Using live data returned from hooking into this types .Load method, we are able to construct a simple data set (a string * int list), which we pass to Chart.Pie using some additional methods to create a ‘not all that great’ chart style! Apologies all, it turns out chart styling isn’t my forte 😉
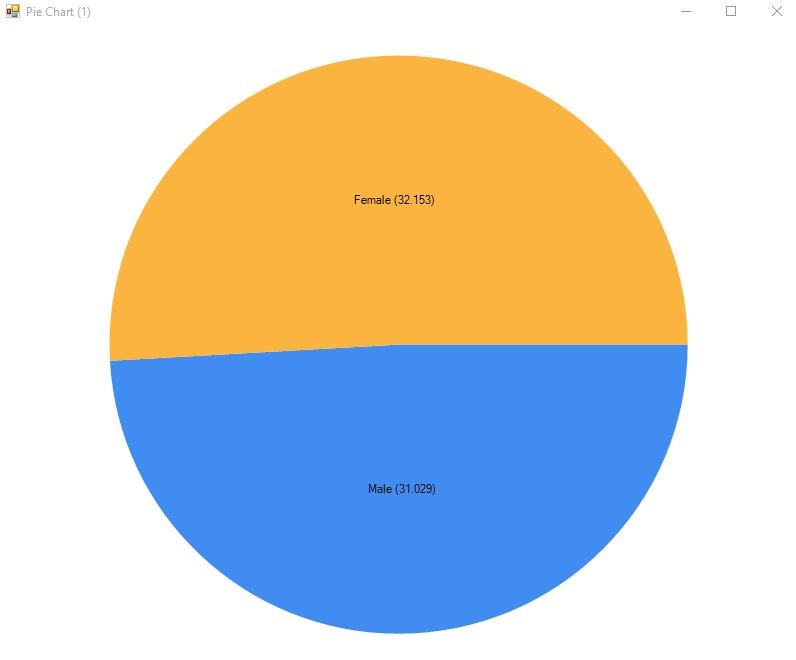
Here’s on additional example showing the split (by millions) of males and females in the UK:
//Provide a type that outlines the page 'structure', so we can strongly type against it
type PopulationHtmlStructure = HtmlProvider<"data_structure_two.html">

//Retrieve live page data (and the relevant population html table)
let populationLiveDataPage = PopulationHtmlStructure.Load("https://en.wikipedia.org/wiki/Demography_of_the_United_Kingdom")
let populationLiveDataTable = populationLiveDataPage.Tables.``Age structure 2``

//Extract some data for Males and Females
let allPopulationData =
    [
        String.Format("Male ({0})", populationLiveDataTable.Rows.[4].Population), populationLiveDataTable.Rows.[4].Population;
        String.Format("Female ({0})", populationLiveDataTable.Rows.[4].Population2), populationLiveDataTable.Rows.[4].Population2;
    ]

//Simpler syntax, just call Chart.Pie with no extra bells and whistles
allPopulationData
|> Chart.Pie

//Produce a 3D pie chart, with some custom styling, based on this data
Chart.Pie(allPopulationData
).WithTitle(Text = "Population by Gender (Millions) - UK", FontName = "Verdana", FontSize = 26.00, FontStyle = FontStyle.Bold
).WithStyling(BorderColor = Color.AliceBlue, BorderWidth = 2
).With3D()

Point Chart
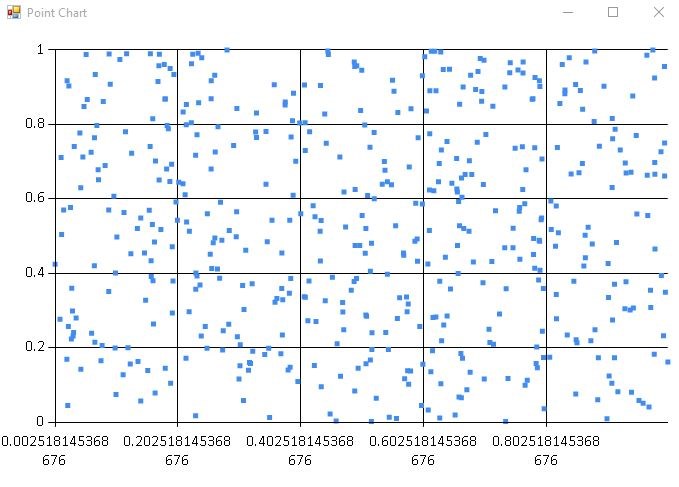
Lastly, here is a randomly generated point chart, just to illustrate how this can be used:
//Declare and bind another 'random'
let anotherRandomValue = new Random()

//Create a basic point chart using the simpler |> syntax (denoting we are calling the basic Chart.Point constructor with no frills)
[for i in 0..500 -> anotherRandomValue.NextDouble(), anotherRandomValue.NextDouble()]
|> Chart.Point
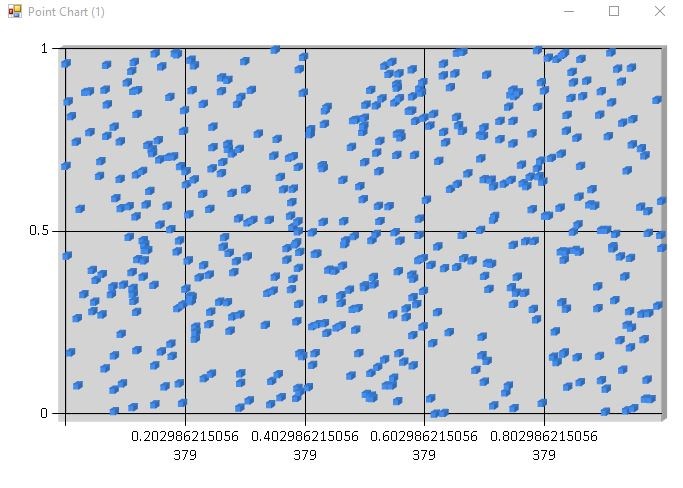
//What does it look like in 3D. Hmmmm, not great!
Chart.Point([for i in 0..500 -> anotherRandomValue.NextDouble(), anotherRandomValue.NextDouble()]).With3D()
I hope this has provided a small insight into how you might use this in the wild. There are a fair few more chart types available so I’ll leave it up to you to dive in! Personally, I can see a window here to get hold of the JsonProvider and use this to access and manipulate data from my Fitbit. This is something I may touch on in the future so watch this space!
Thanks for reading through; full code listing below for convenience. Cheers and bye for now 🙂
Full Listing
//FSharp Charting (with HtmlProvider usage) - Full Scripting Example

//#region Setup

//Navigate to the directory containing the FSharp.Charting.fsx file
#I "..\packages\FSharp.Charting.0.90.13"

//Read, compile and run the FSharpt.Charting.fsx file (to access the functionality of FSharp.Charting.dll)
#load "FSharp.Charting.fsx"

//Read in the FSharp.Data and FSharp.Data.TypeProviders assemblies (so we can make use of the HtmlProvider)
#r @"..\packages\FSharp.Data.2.2.5\lib\net40\FSharp.Data.dll"
#r @"..\packages\FSharp.Data.TypeProviders.0.0.1\lib\net40\FSharp.Data.TypeProviders.dll"

//Access namespaces as required by the examples. System for the 'Random' type and use of String.Format, FSharp.Data for the HtmlProvider, FSharp.Charting for what is says on the tin
//and System.Drawing for chart styling elements
open System
open FSharp.Data
open FSharp.Charting
open System.Drawing

//#endregion Setup

//#region Line Chart

//Define an array of resting heart rate values
let restingHeartRateValues = [69; 74; 76; 71; 68; 65; 64; 79; 80; 75; 72; 65; 63; 62; 59; 65; 80; 61; 59]

//Produce a line chart to visualise this data (with a Name, Title and labels for the X and Y axis)
Chart.Line(restingHeartRateValues, Name = "Resting Heart Rate Chart", Title = "Resting Heart Rate by Days", XTitle = "Days", YTitle = "Heart Rate (BPM)"
).WithYAxis(Min=55.0).With3D() //X Axis starts at 55 and with 3D

//#endregion Line Chart

//#region Column Chart

//Produce some test data (representing a drop in Kindle charge by day)
let kindleChargeData = [
    "Monday", 100;
    "Tuesday",
    "Wednesday", 87;
    "Thursday", 76;
    "Friday", 61;
    "Saturday", 55;
    "Sunday", 50;
]

//Produce a column chart (with some basic styling for the chart; covering colours and borders, etc.)
Chart.Column(kindleChargeData, Color=Color.Green, Name = "Kindle Charge Chart", Title = "Decrease in Kindle Charge by Day"
).WithXAxis(Title = "Day", TitleColor = Color.Purple
).WithYAxis(Title = "Charge", TitleColor = Color.Purple, Max = 100.00           //Apply a max here to prevent the chart from going beyond 100 on the Y axis
).WithStyling(BorderColor = Color.DarkRed, BorderWidth = 3
).With3D()                                                                      //Because I can't resist!!!

//A brief Chart.Combine example
Chart.Combine(
    [
        Chart.Column([ 12 ], Labels = ["Amy"])
        Chart.Column([ 9 ], Labels = ["Buster"])
        Chart.Column([ 10 ], Labels = ["Dave"])
        Chart.Column([ 13 ], Labels = ["Shirley"])
        Chart.Column([ 7 ], Labels = ["Stephanie"])
        Chart.Column([ 11 ], Labels = ["Bob"])
    ]
    ).WithTitle(Text = "Tasks Completed"
    ).WithXAxis(Title = "No. of Tasks"
    ).WithYAxis(Max = 15.00)

//#endregion Column Chart

//#region Bar Chart

//Bind a new variable to use in RNG
let randomValue = new Random()

//Using alternative syntax this time as we are not calling a more complex Chart.Bar constructor (for styling purposes, etc.). Do some RNG and produce a bar chart
[ for i in 0..15 -> i * randomValue.Next(10, 20) ]      //For zero to fifteen, times i by a random value (between the minimum and maximum specified)
|> List.map(fun i -> i + randomValue.Next(1, 2))        //Map the result list to another function that adds another random value (between the minimum/maximum specified) to each initial value
|> Chart.Bar                                            //Produce the chart

//#endregion Bar Chart

//#region Pie Chart

//---------------PIE CHART EXAMPLE ONE---------------

//Get a type denoting our pages structure (so we can strongly type against it), then retrieve live data by calling .Load
type WikiSurreyLeighStructure = HtmlProvider<"data_structure.html">
let liveDataTable = WikiSurreyLeighStructure.Load("https://en.wikipedia.org/wiki/Leigh,_Surrey").Tables.``Demography and housing 2``

//Prepare data scraped from the web page (details on the housing types in Leigh, Surrey)
let propertyTypeData = [
    String.Format("Detached ({0})", liveDataTable.Rows.[0].Detached), liveDataTable.Rows.[0].Detached
    String.Format("Semi-Detached ({0})", liveDataTable.Rows.[0].``Semi-detached``) , liveDataTable.Rows.[0].``Semi-detached``
    String.Format("Terraced ({0})", liveDataTable.Rows.[0].Terraced), liveDataTable.Rows.[0].Terraced
    String.Format("Apartments ({0})", liveDataTable.Rows.[0].``Flats and apartments``), liveDataTable.Rows.[0].``Flats and apartments`` ]

//Display this data in a styled pie chart
Chart.Pie(propertyTypeData
).WithTitle(Text = "Property Types in Leigh (Surrey)", FontSize = 26.00, FontStyle = FontStyle.Bold
).WithStyling(BorderColor = Color.BlueViolet, BorderWidth = 2
).With3D()

//---------------PIE CHART EXAMPLE TWO---------------

//Provide a type that outlines the page 'structure', so we can strongly type against it
type PopulationHtmlStructure = HtmlProvider<"data_structure_two.html">

//Retrieve live page data (and the relevant population html table)
let populationLiveDataPage = PopulationHtmlStructure.Load("https://en.wikipedia.org/wiki/Demography_of_the_United_Kingdom")
let populationLiveDataTable = populationLiveDataPage.Tables.``Age structure 2``

//Extract some data for Males and Females
let allPopulationData =
    [
        String.Format("Male ({0})", populationLiveDataTable.Rows.[4].Population), populationLiveDataTable.Rows.[4].Population;
        String.Format("Female ({0})", populationLiveDataTable.Rows.[4].Population2), populationLiveDataTable.Rows.[4].Population2;
    ]

//Simpler syntax, just call Chart.Pie with no extra bells and whistles
allPopulationData
|> Chart.Pie

//Produce a 3D pie chart, with some custom styling, based on this data
Chart.Pie(allPopulationData
).WithTitle(Text = "Population by Gender (Millions) - UK", FontName = "Verdana", FontSize = 26.00, FontStyle = FontStyle.Bold
).WithStyling(BorderColor = Color.AliceBlue, BorderWidth = 2
).With3D()

//#endregion Pie Chart

//#region Point Chart

//Declare and bind another 'random'
let anotherRandomValue = new Random()

//Create a basic point chart using the simpler |> syntax (denoting we are calling the basic Chart.Point constructor with no frills)
[for i in 0..500 -> anotherRandomValue.NextDouble(), anotherRandomValue.NextDouble()]
|> Chart.Point

//What does it look like in 3D. Hmmmm, not great!
Chart.Point([for i in 0..500 -> anotherRandomValue.NextDouble(), anotherRandomValue.NextDouble()]).With3D()

//#endregion Point Chart

4 thoughts on “Chart-tastic F# Goodness”