A little sideline post to tide everyone over (as I’m still working on the Alexa piece, which I want to do proper justice to when it’s released). I’ve been messing around with a few rough and ready projects and wanted to get an idea of how to dig into code coverage, in respect of Unit Tests.
I’m currently using Visual Studio 2015 Community Edition and from what I gather no built-in support exists for non-enterprise editions, at the moment. The first hit I found was for the OpenCover UI extension; so I thought I’d take it for a spin to see what it’s made of:
Stack Overflow OpenCover UI Mention
Just so that you can get a feel for where I am at, here is an image outlining a home-brew project that shows some Unit Tests in play:

Nothing too miraculous here, I’m just using the standard Unit Testing framework and a little Moq for kicks. To follow this up, I then grabbed hold of the OpenCover UI (.vsix extension) from here and installed it:
OpenCover UI VS Marketplace Link
Let’s roll on from here with some ‘off the cuff’ observations, rather than in-depth review of features, etc. This serves as simply my first impressions and, ultimately, an insight into if we can get the coverage metrics I am after quickly and easily. For starters, you’ll notice a new context menu for ‘OpenCover’ when Visual Studio boots up:
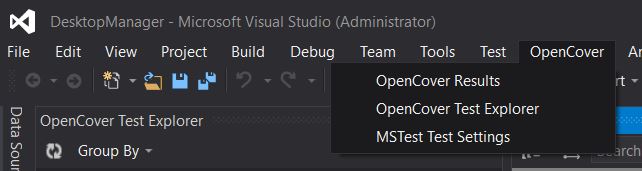
I have quickly shoved the inbuilt Test Explorer window next to the OpenCover variant; they appear to offer a similar ‘look and feel’, in addition to functional grouping options (the default Test Explorer windows appears to have a few more options, in fact). The OpenCover Test Explorer oddly doesn’t have a ‘Run’ or ‘Run All’ tests buttons, on the face of it anyway (or debugging options). Right clicking a test gives a ‘Cover with OpenCover’ context menu option…guess I’ll see what that does now!

At this point I hit the following, immediate, explosion:
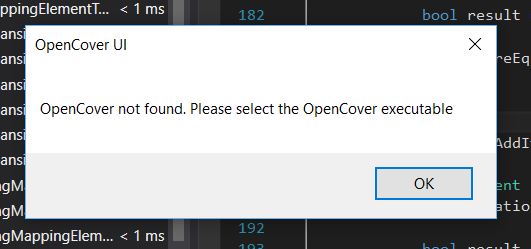
You then get prompted to hunt down the relevant .exe file. As I was fishing around for this I decided to go back to the trusty Stack Overflow, to see what wisdom could be uncovered. This was the first hit, which outlined that a configuration file, with set content, needed to be stuffed in with the solution content:
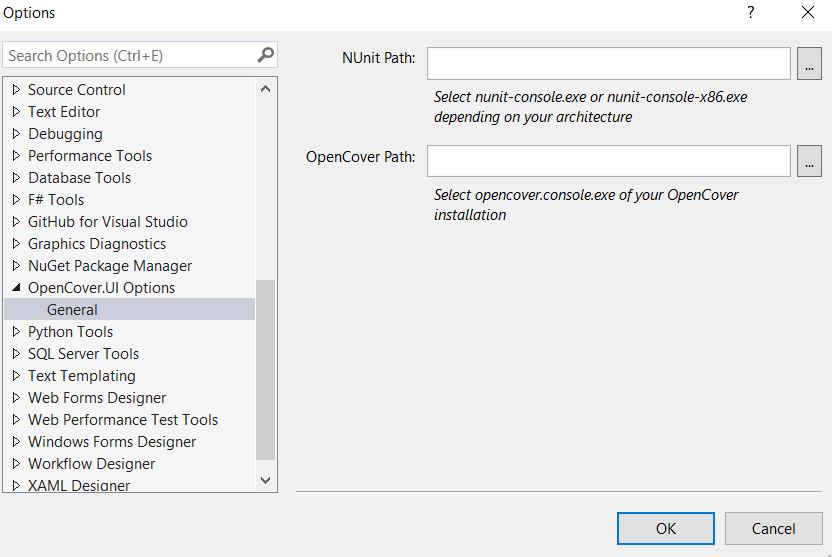
Further comment sniffing did highlight, under Tools > Options, that additional configuration should be performed (i.e. the .exe path should be specified):
I decided that hunting on NuGet might be the best way to expose an .exe file here (i.e. getting something dropped into a packages directory, which I can easily pick up). So, I followed the hunch by adding this package (just to the ‘tests’ project, for starters, as I wasn’t sure which projects needed targeting):

I don’t feel as if we’ve fallen into a rabbit hole just yet, but at this point, I’ve started to wonder if ‘storms’ are on the horizon! Hopefully, we won’t have to tread too much further to get this machine churning. Installing the NuGet package had the desired effect, I have now got the .exe I was looking for lingering in a ‘Tools’ directory, under the OpenCover folder within packages, which I’ve setup in the Visual Studio Options section:
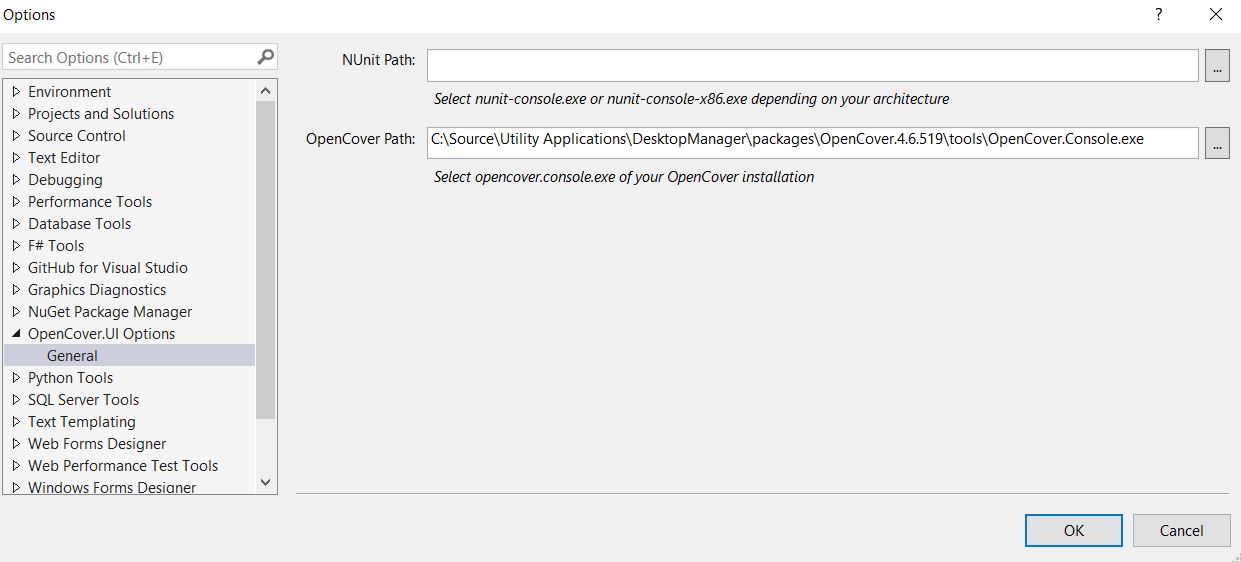
This shouldn’t be marked down as ‘ideal’ configuration, of course; we’re more leaning towards a ‘just get it working’ stance.
The moment of truth…..right clicking and selecting ‘Cover with OpenCover’ now….success! Well, good things appear to have happened anyway, let’s have a quick review to see if we can make sense of it (code with incomplete XML comments is about to be on show, so apologies about that!). I only ran the one test by the way:
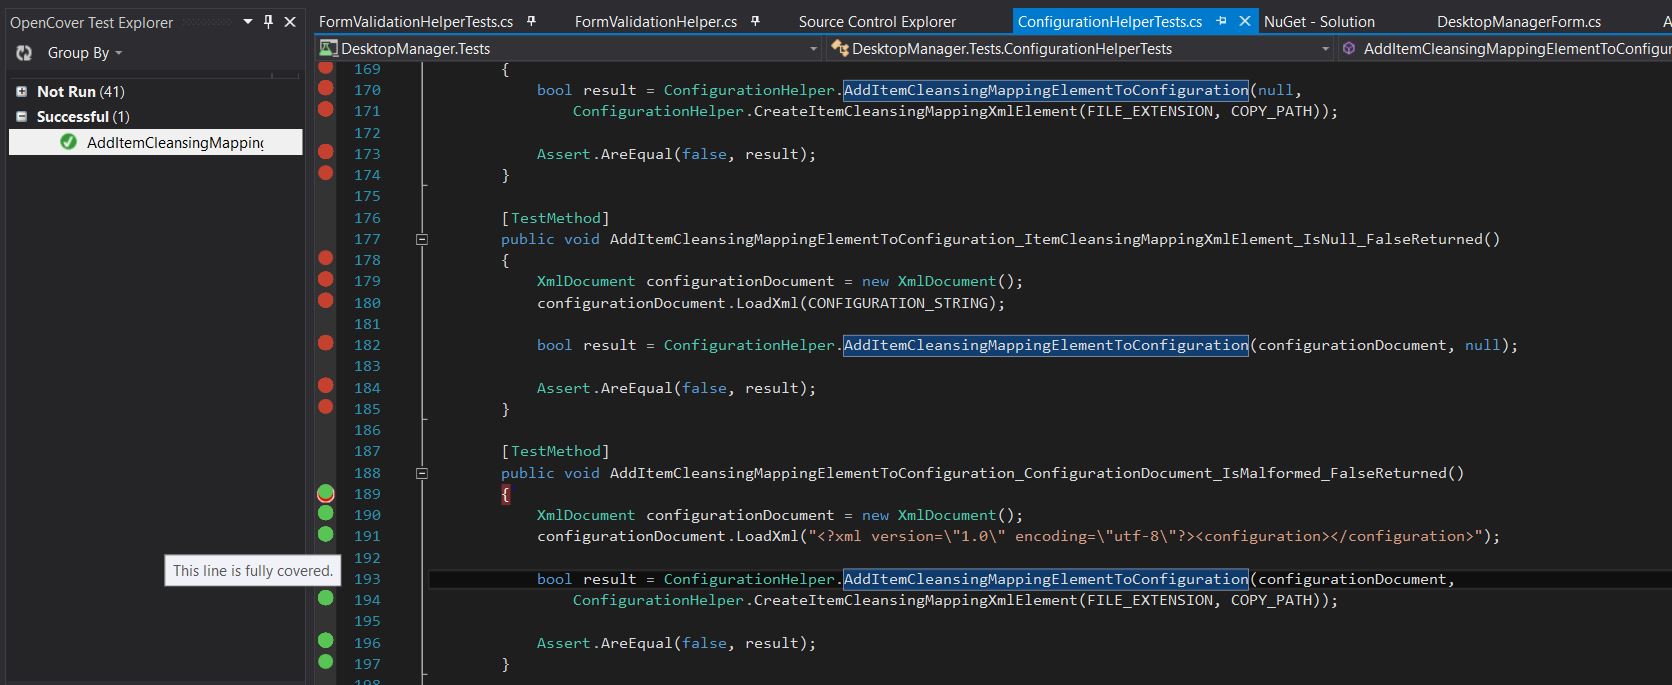
First observation; it did seem to take a good few seconds before all of the lines covered (green dots) and not covered (red dots) seemed to be highlighted correctly, nothing too catastrophic in this, however. As far as the unit testing specific code goes, here you can clearly see which tests I ran in this instance, the UI pointers are very self-explanatory. One additional observation, it looks like it could be a touch tricky to pick out breakpoints amongst the code coverage markers, but I don’t see this as a big issue at the moment (I’ll have to see how I feel after extended use). In fact, the OpenCover Results window has an option for enabling/disabling these markers, so we’re all good.
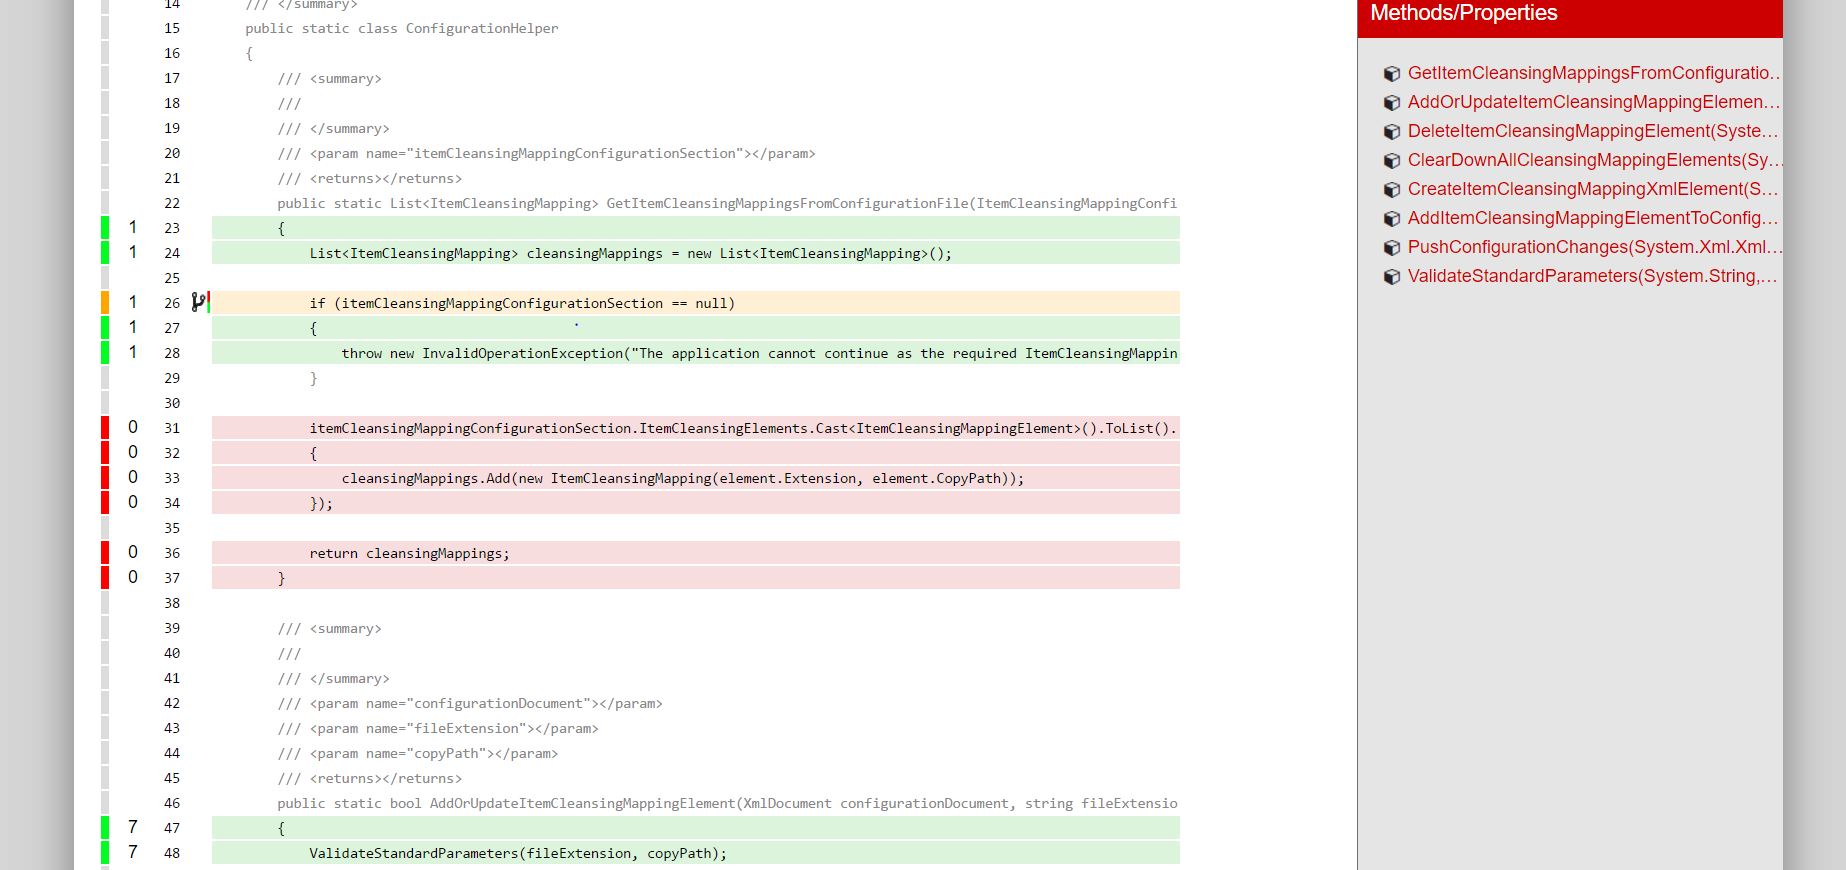
You’ll notice that the unit test method denoted here is placing the ‘AddItemCleansingMappingElementToConfiguration’ method under test, so I am keen to see what lines we hit (or ‘covered’) within the targeted method:
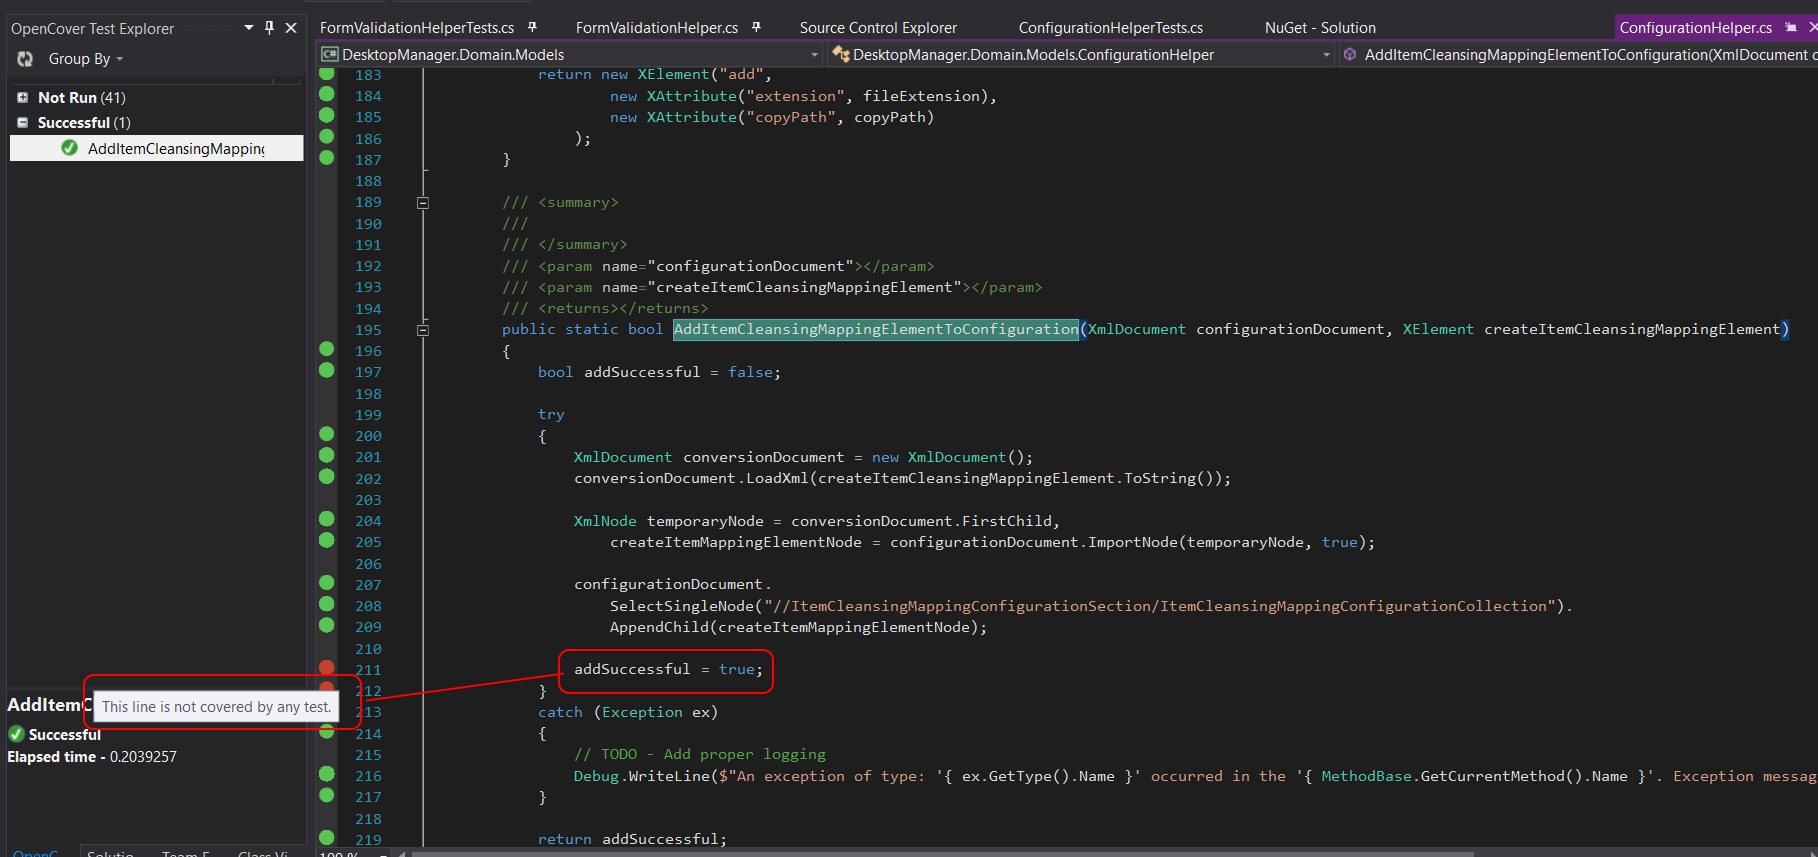
The idea here is that the XML configuration passed to this method is, in fact, malformed so the statement where the ‘addSuccessful’ variable is set to true is not hit (an exception is triggered, and caught, by the preceding line of code); which mirrors the indicator provided by OpenCover, nice! I call this a success!
I’m now going to run this across the board and see what floats to the surface.
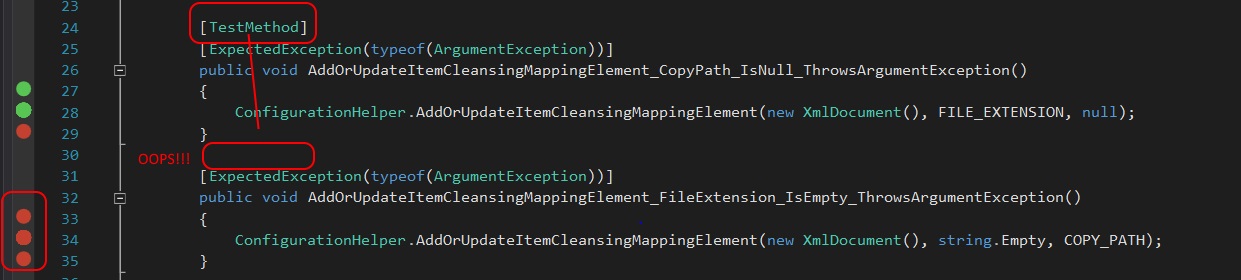
Ah, look at this! For starters, OpenCover has highlighted a problem with one of my unit tests in a very solid, visual way (I was wondering why no lines of this test were covered, until I realised I omitted the ‘Test Method’ attribute!):
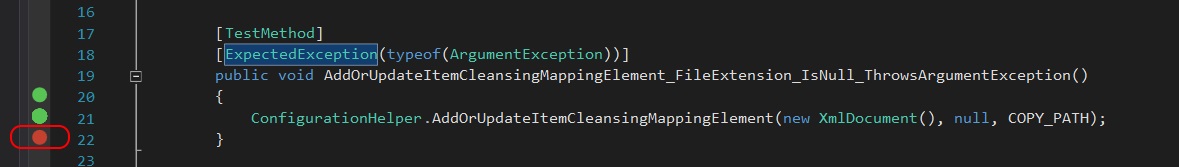
A couple of quirks that deserve to be noted; firstly, I did have to run the ‘Cover with OpenCover’ command twice to register coverage on all tests (some seemed to be omitted from the process, but then included on the second run through). Also, tests that are geared to expect exceptions to be thrown are always marked with their closing brace as ‘not covered’ (I’m assuming that an exception being thrown legitimately causes the final line to never be hit, therefore not covered, which in my head is expected behaviour – it would be good if there was a way to disregard these instances):
So what about the actual code ‘under test’ and the metrics provided to show how much of it has been covered? In instances whereby code had been highlighted as not covered (spot checks only, of course), I have to say it appears accurate and has been useful in flagging areas I should really have tested.
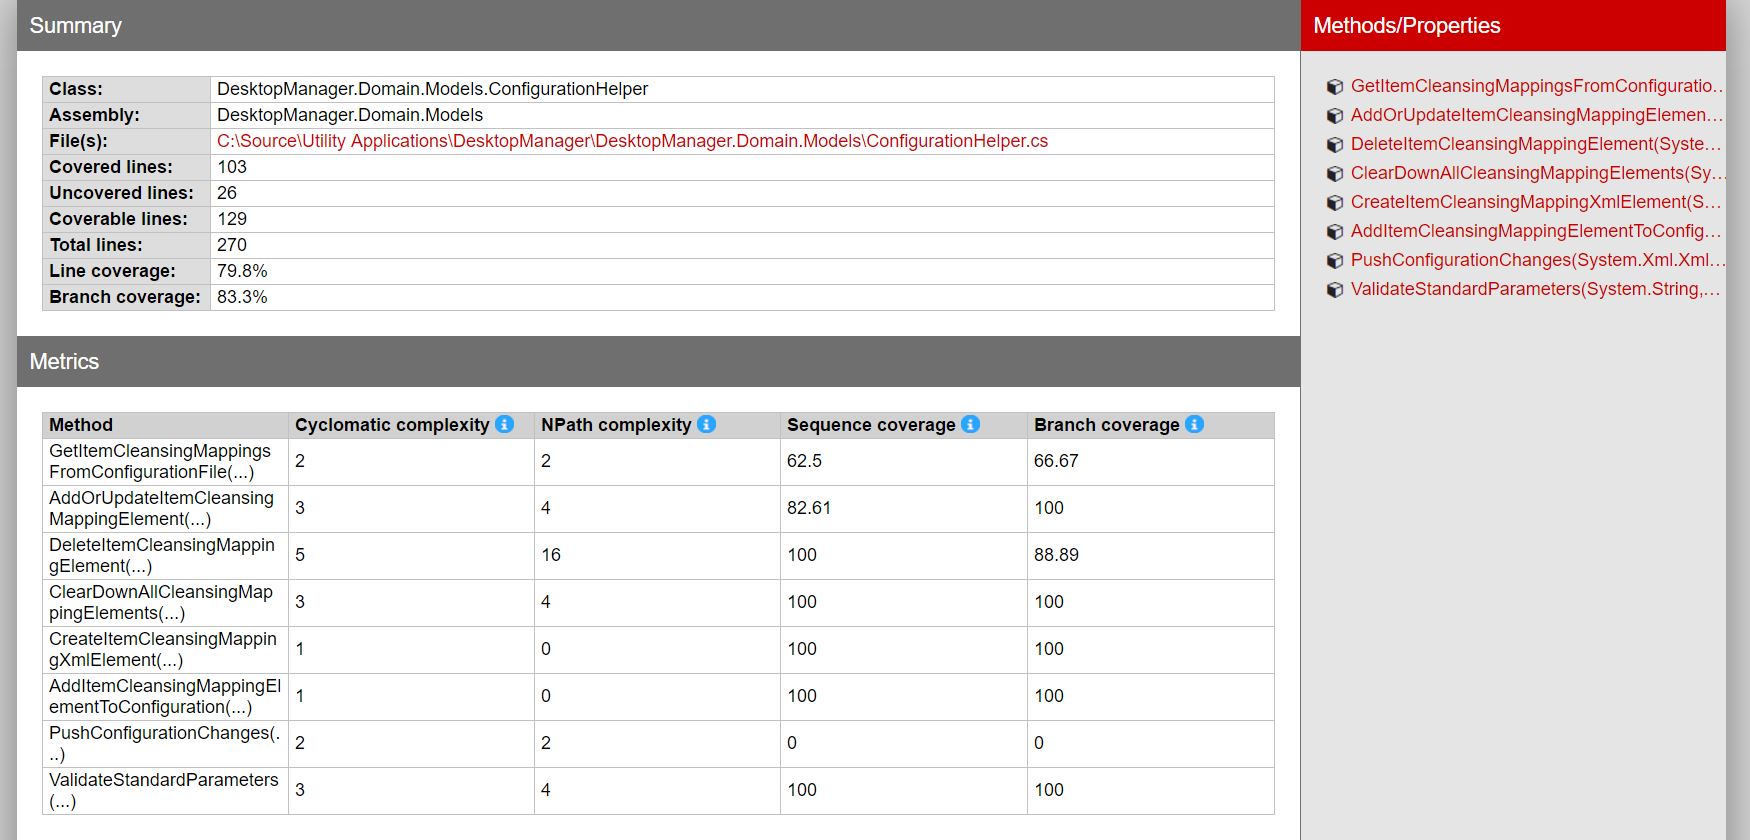
As for the actual report metrics, it is exactly what I was after when I started on my way down this road. You get to see the percentage of code coverage at project, class and member level (along with ‘Sequence Points’ visited against the total count of possible points):
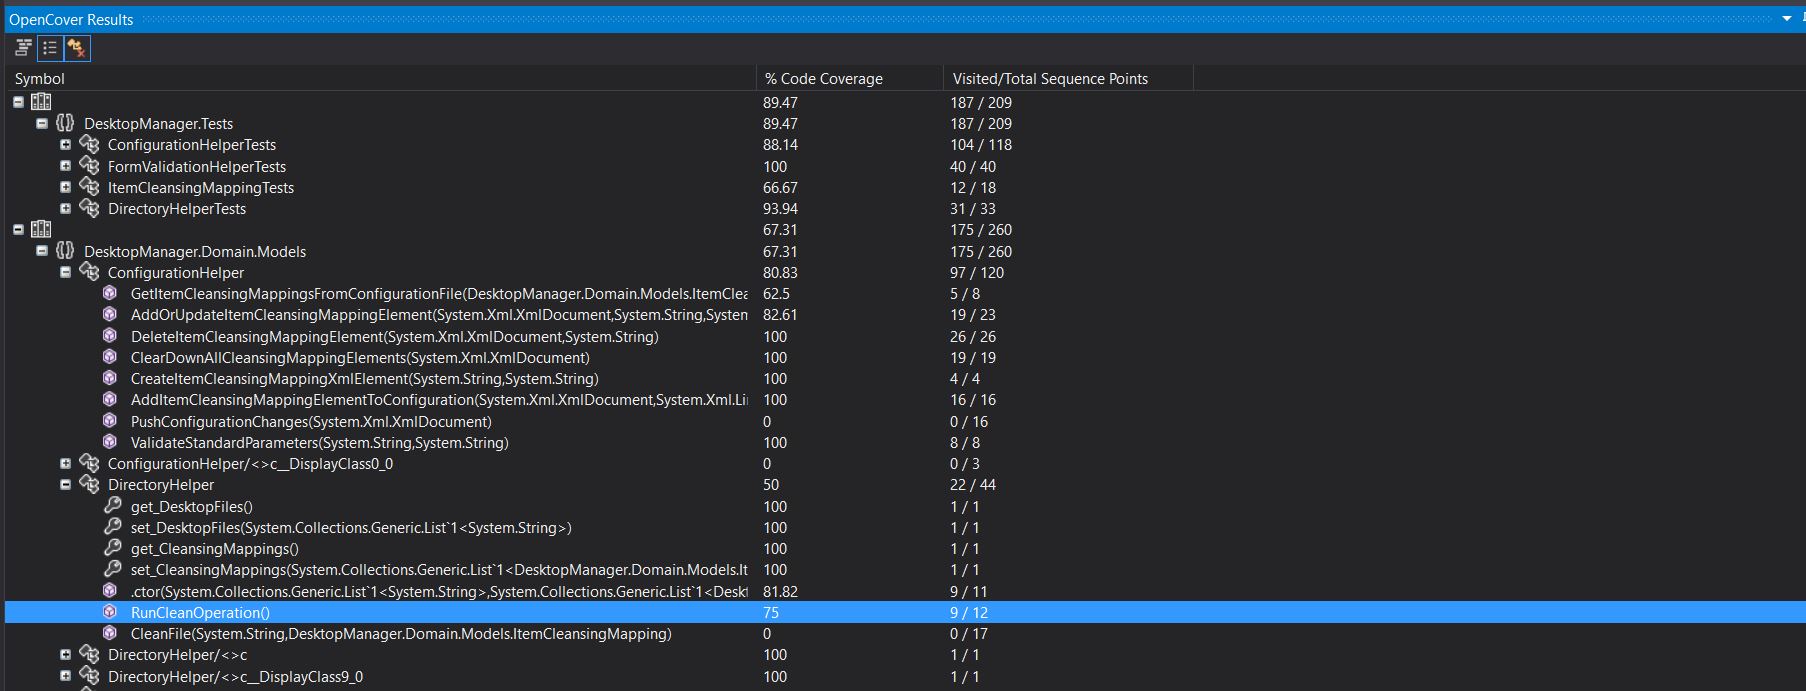
Sequence points don’t tie directly to ‘lines’, as outlined here. You’ll notice that this is a link detailing a ‘Report Generator’, which uses XML extracted using OpenCover directly. To finish up, I’ll follow the steps outlined on Stack Overflow again (got to love it, especially if you need information on the double!):
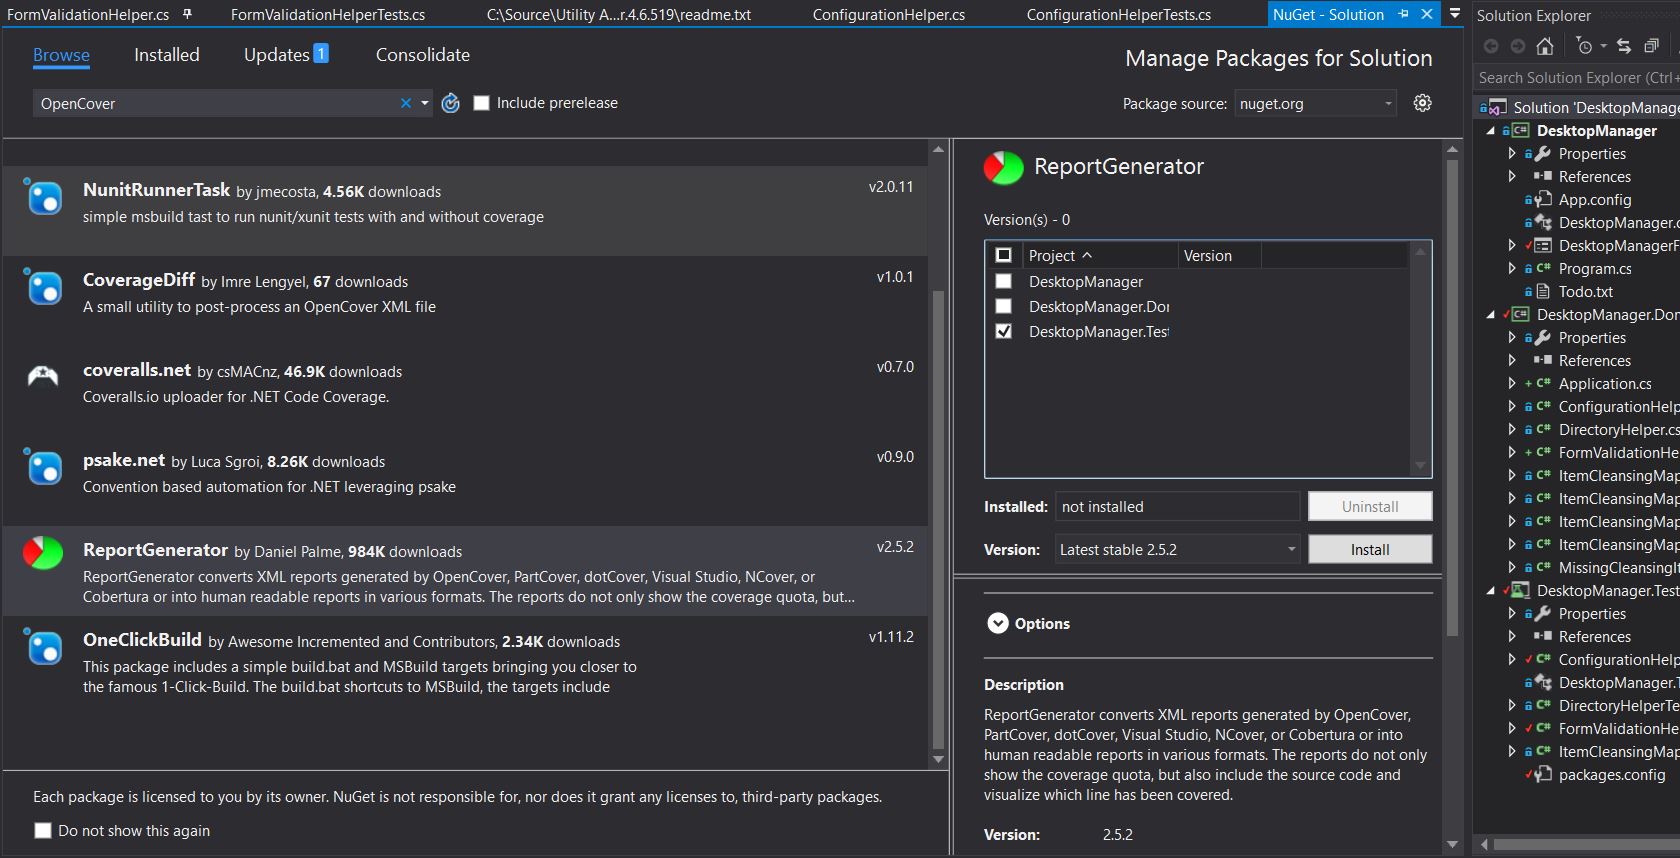
The Report Generator can be downloaded by using NuGet again:
The Report Generator source code itself can be downloaded from this link.
It looks like you can create a custom report via C#, by implementing an interface, etc. For now, I’m going to do a simple run through using the command line interface. This is the command (after a bit of trial and error) that got me the XML report, for starters:
"C:\Source\Utility Applications\DesktopManager\packages\OpenCover.4.6.519\tools\OpenCover.Console.exe" -register:user -target:"C:\Program Files (x86)\Microsoft Visual Studio 14.0\Common7\IDE\mstest.exe" -targetargs:"/noisolation /testcontainer:\"C:\Source\Utility Applications\DesktopManager\DesktopManager.Tests\bin\Debug\DesktopManager.Tests.dll\" /resultsfile:C:\Reports\MSTest\.trx" -mergebyhash -output:C:\Reports\MSTest\projectCoverageReport.xml
This was just a case of specifying locations for the OpenCover.console.exe, the mstest.exe and the location of the ‘Tests’ dll for my specific application. XML file in hand, I trigerred this command to generate the final report resources:
"C:\Source\Utility Applications\DesktopManager\packages\ReportGenerator.2.5.2\tools\ReportGenerator.exe" -reports:"C:\Reports\MSTest\projectCoverageReport.xml" -targetdir:"C:\Reports\CodeCoverage"
In a few quick steps you’ll have a set of HTML ‘reports’, as you can see here:
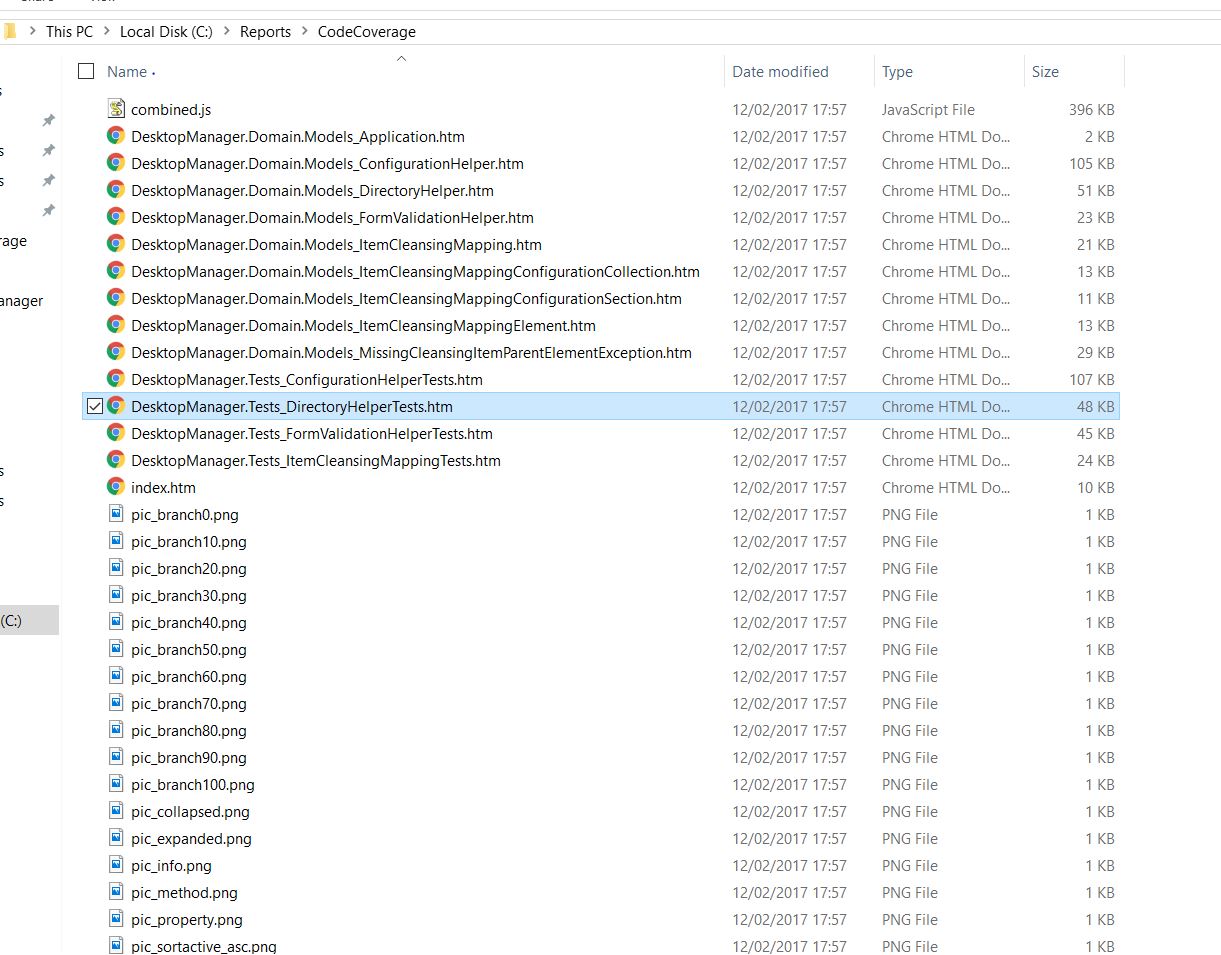
Let’s finish up with a couple of examples illustrating the outputs:
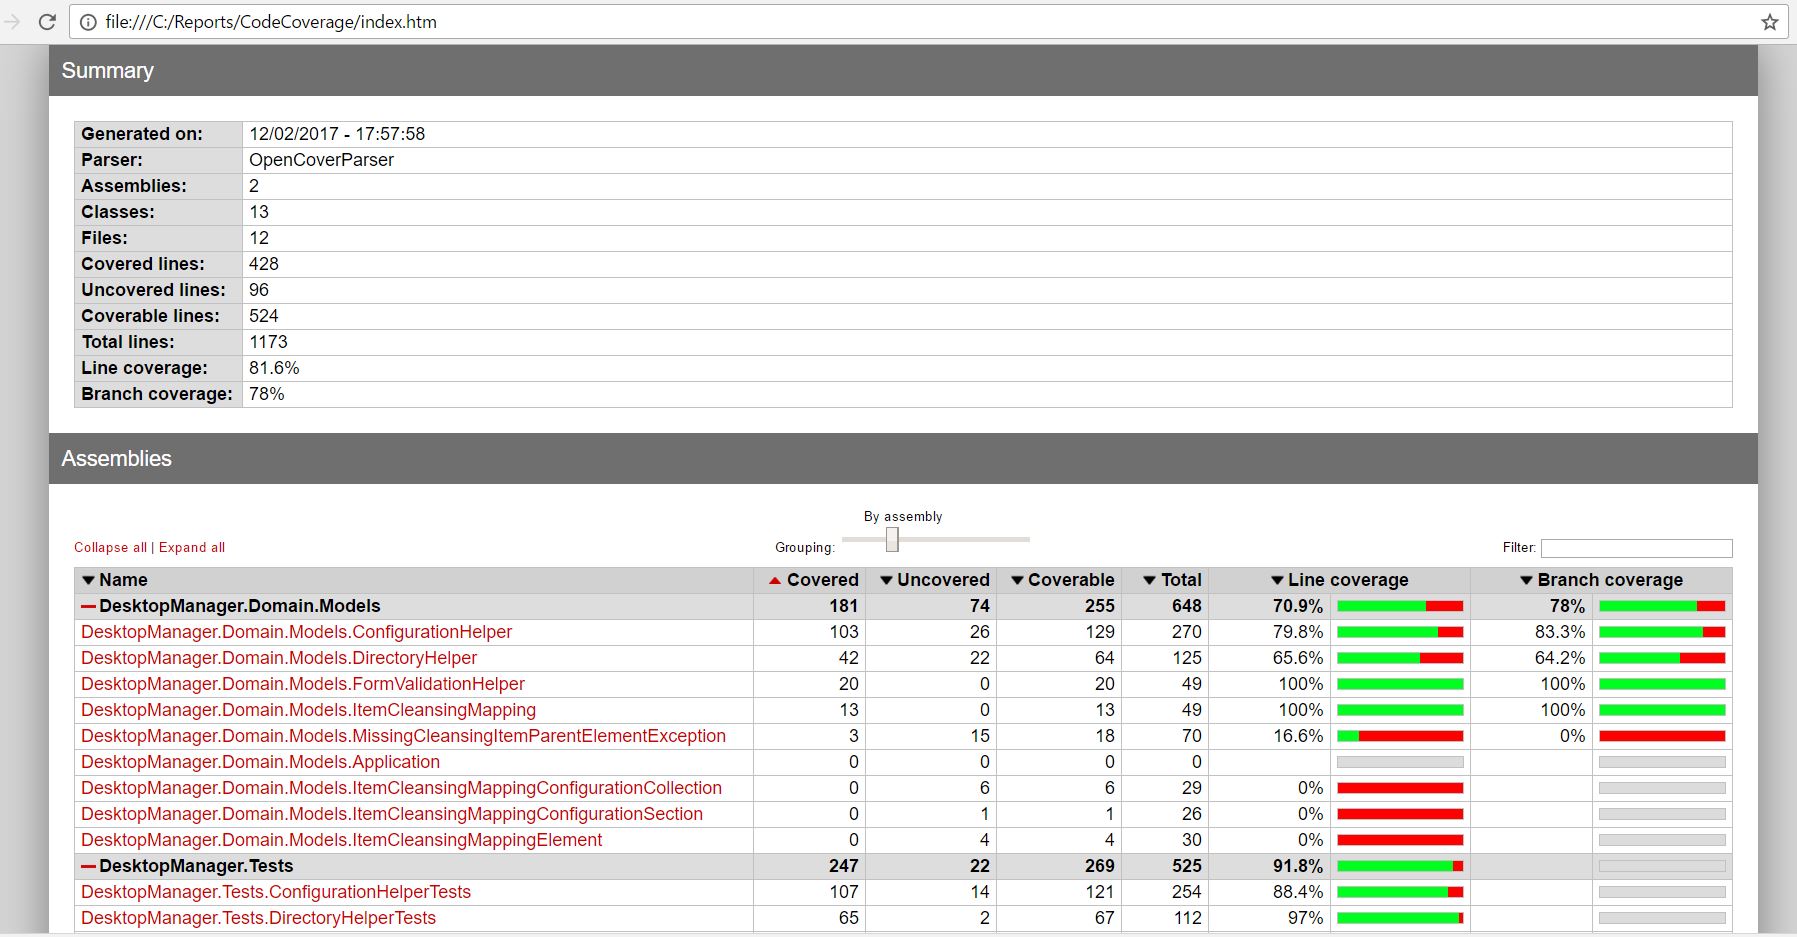
I think that brings us to a close. This seems like pretty powerful stuff; but, I think I’ll need more time to go through some of the outputs and try this with a larger project. I hope this has been fun and/or useful.
Thanks all!
